In October 2017, the UTHealth Facilities, Planning, and Engineering (FPE) department submitted its Energy and Water Management Plan (EWMP) to the State Energy Conservation Office (SECO) with an aggressive new 5% campus energy-consumption reduction goal to be reached by the end of FY 2021. By the end of FY 2020, total energy consumption decreased by approximately 10%, surpassing the 2021 goal and yielding a total cost savings of nearly $3.5 million.
The UTHealth Main campus is located in the Texas Medical Center in Houston. The 3 million sq.-ft. campus includes research, education, and office buildings. In FY 2016 and 2017, the annual cost of utilities exceeded $15 million.
In spring 2017, FPE formally established an energy conservation committee, including the FPE leadership, senior digital control technicians, maintenance supervisors, project managers, and outsourced engineers, to develop a comprehensive energy plan. The energy plan established a base list of energy conservation opportunities (ECOs). The committee then began work on revising the existing energy plan into a more comprehensive document focusing on a prioritized list of ECOs. The ECO committee meets monthly to update, revise, and review strategies, policy, and best practices.
Key components of the energy reduction plan include the following:
- The campus temperature control policy establishes campus-wide temperature and humidity standards to accommodate user and equipment needs while minimizing utility costs.
- Reset and economizer programs include automation software that optimizes HVAC system efficiency by continuously monitoring and adjusting setpoints based on indoor and outdoor air conditions.
- Occupancy sensors are installed in laboratories and offices to control lighting and HVAC.
- Use outside air during the winter months to produce chilled water for cooling.
- Use a proprietary system to measure indoor air quality in research spaces in order to reduce Outside air intake.
- Monitor fume hood sash positions using a proprietary graphical tool to prevent conditioned air from being unnecessarily exhausted.
- Implement LED lamp and fixture upgrades to improve indoor lighting quality and reduce utility costs.
- Conduct a wind study/exhaust fan energy reduction audit and implement a program to safely reduce the air flow rate while minimizing fan energy consumption.
- Graphical tools are used to monitor HVAC performance and identify equipment malfunctions.
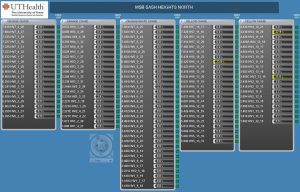
Figure 1: Sash Hood Monitoring with BAS
Campus Temperature Control Policy
The campus temperature control policy specifies operations between 70°F and 74°F during the day and between 65°F and 80°F after hours. Some exceptions are made for research areas and special equipment, as needed.
Occupancy Sensors and People Counters in Laboratories and Offices
Since 2018, ECO strategies and project management initiatives have focused on installing occupancy sensors for lighting and HVAC systems. The installation of these sensors has reduced both lighting and HVAC consumption in unoccupied areas. Air exchange rates in laboratories are now reduced to as few as four air changes per hour (ACH) when laboratories are empty. The value of these sensors is enhanced when people are given the opportunity to work remotely because of the further reduction of lighting and HVAC needs.
A people counter occupancy sensor enables the reset/reduction of outside air during reduced occupancy. A strategy was developed that totals the number of occupants and adjusts the outside air required based on that number. The smart sensors are reset daily to help maintain an accurate count.
Resets and Economizer Programming
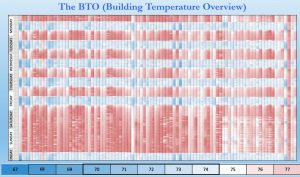
Figure2: BTO Output to Show a Building Footprint
The humid Houston climate requires dehumidification for much of the year. The indoor relative humidity (RH) standard is less than 60%. The air-handling unit (AHU) designs typically require a discharge air temperature of 52°F, which satisfies most dehumidification and temperature requirements. We use the following values to determine the discharge air temperatures:
- Outside air temperature
- Outside air dew point
- Minimum zone temperature
- Maximum zone temperature
- Average zone temperature
During occupied hours, the target cooling zone temperature is 73.5°F. The minimum heating setpoint is 70°F.
The next level of resets is the economizer mode, also known as the airside economizer. When the outside air is sufficiently cool and dry enough to meet the needs of the zones served, the outside air, return, and relief/exhaust dampers work together to satisfy a mixed air-temperature setpoint.
Free Cooling
The free cooling strategy works in buildings that condition a high volume of outside air, usually because their laboratories require 100% outside air. During the summer, these buildings require low AHU discharge air temperatures for dehumidification; reheating is then necessary to warm the air to the room temperature setpoint. However, when the temperature and humidity levels are sufficiently cool and dry, free cooling can be used. The outside air AHU chilled water valves are fully opened rather than closed off, and heat is transferred from the chilled water to the outside air. The primary cooling source for the chilled water is stopped, but the water continues to circulate. The temperature at which this occurs varies, based on zone requirements. It is programmed and self-adjusting, reducing chilled water tonnage to zero and reducing reheat and preheat loads.
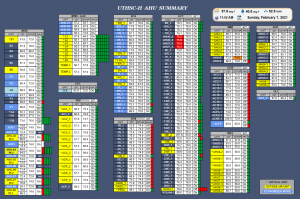
Figure 3: AHU Summary Tool Output
Proprietary System
In 2019, the Medical School Expansion, which houses the largest vivarium on campus, implemented a proprietary system to monitor a range of contaminants, notably volatile organic compounds (VOCs), ammonia, carbon dioxide, and small particulates. This process, which monitors indoor environmental quality (IEQ), is used to determine when air change rates can be reduced. Air is sampled before it enters the space and when it is exhausted from the space. The difference between the two values measures the level of contamination. Normal engineered minimum air change rates for a vivarium can be greater than 20 ACH. By sampling the air, this system reduces the air change rate to as few as six ACH in a process known as demand control ventilation (DCV). When the system detects an IEQ reduction, air exchanges are automatically increased.
Fume Hood Sash Position Monitoring
Fume hoods in laboratories are used to temporarily house chemicals or when working with hazardous substances. The fume hoods enable fumes to be immediately exhausted from the building. The front of the hood, or sash, is lifted while working in the fume hood. Air flow increases as the sash height increases, in order to maintain a minimum air velocity across the face of the hood. Hood sashes left in the raised position waste energy. Sash positions are monitored with the building automation system (BAS) (Figure 1) and checked after hours. While making nightly rounds, facilities personnel close sashes that are left open.
LED Upgrades
LED upgrades began in 2018. In some cases, LED bulbs replaced florescent bulbs in existing fixtures; in other cases, the lighting fixtures were replaced. Dimmable fixtures were installed in many locations to enable reduced light levels where applicable. Although results vary, one project yielded a 79% reduction in kW usage after changing from fluorescent to LED. The project managers, senior digital control technicians, and maintenance teams changed approximately 1,100 bulbs and replaced 5,400 light fixtures campus-wide. The larger projects, completed by the project management team, accounted for most of the fixture replacements and received utility rebates of more than $50,000.
Wind Study/Exhaust Fan kW Reduction
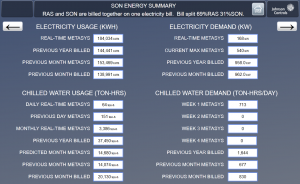
Figure 4: Energy Summary Tool Output
Most of the exhaust manifolds have two or three exhaust fans and bypass dampers that modulate to control the manifold pressure. This sequence works well, but a great deal of air passes through the bypass dampers. Exhaust fans use variable-frequency drives and normally operate at 60 Hz to ensure the proper plume ejection velocity. Regulations and wind-modeling changes can enable sequence changes that increase energy efficiency.
Under the direction of an engineer, changes were implemented on the largest manifold system, which includes 18 fans and 18 bypass dampers. The new strategy closed bypass dampers and reduced the exhaust fans’ speed (kW). Modeling was performed to determine the minimum fan speed required for safety under current guidelines. Early estimates for the changes indicate approximate annual savings of $100,000.
Graphical Tools
The controls team leverages the BAS and 350,000 data points to enable real-time data use for programming and creating graphical tools to help manage energy savings. The graphical tools created include the Building Temperature Overview (BTO), AHU Summary, and Energy Summary tools.
Building Temperature Overview (BTO) Tool
The BTO tool (Figure 2) shows the temperature footprint of a building. The tool uses distinctive colors to help identify trouble areas; it detects part failures and installation oversights. An SQL Server query for data extraction and Microsoft Excel programming are used to associate colors with temperatures.
AHU Summary Tool
The AHU Summary tool (Figure 3) monitors all AHUs on campus and helps to quickly identify units that may be overcooling or have potential failures. A blinking function is used to indicate critical faults.
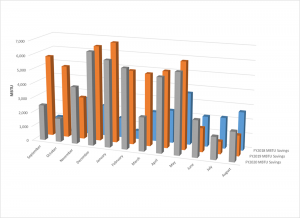
Figure 5: ECO Savings Comparison
Energy Summary Tool
The Energy Summary tool (Figure 4) tracks chilled water ton hours (ton-hours), electricity (kWh), and the demand for each utility. This feature enables usage monitoring throughout the month as well as comparison with the previous month and the same month of the previous year. The detection of unusual trends helps to address energy-waste issues.
Results
Energy savings are measured by tracking the top three utilities (chilled water, electricity, and steam). These utilities are converted to BTUs, or thousands of BTUs (MBTUs). Figure 5 represents MBTU and cost reduction over the last three years.
Closing Comments
All components of the energy plan have contributed to positive results. The resets, economizers, and free cooling strategies have the lowest implementation costs, particularly if BAS programming skill sets are available in-house. Temperature sensors and flow stations must be accurate, however, and dampers and valves must function properly. These strategies and proprietary tools help to detect device and equipment failures. ECOs such as occupancy sensors and proprietary systems are effective but require more upfront cost and some programming. In addition, a comprehensive plan includes the infrastructure, age, controls, purpose of a building, and industry standard best practices along with some less-common strategies, as well as a good understanding of HVAC, psychrometrics, and digital controls. Ultimately, we plan to continue this program beyond 2021, which will include setting new objectives.
Also, we acknowledge that the COVID-19 pandemic occurred during the last year of this plan, and we will continue to evaluate the effects of this occurrence throughout the campus. However, because most of the savings came from our laboratory research buildings and were accumulated before the pandemic, we believe the pandemic had a minimal effect on the overall savings. All buildings remained operational throughout the pandemic.
Bobby Watson is director of utilities, controls and energy management at UTHealth Texas Medical Center in Houston, TX. He can be reached at [email protected]. This is his first article for Facilities Manager.


